Vattenfall has commissioned EVtools to produce Plan and Forecast maps for the charging infrastructure for 74 municipalities in Brabant and Limburg. This is the first time in the Netherlands that the data-driven roll-out of charging points has been set up on such a large scale for multiple years. “This approach is becoming the trend,” say Vattenfall’s Alied Wessels Boer and Sjors van Hedel. They reveal the benefits of this approach and the lessons learned.
As Manager Public Sector E-mobility, Alied is responsible for procurement and contract management for public concessions. “In Amsterdam we even worked with KPIs for the placement of extra charging points, but this is the first time we have ever tackled such a large project structured in this way.”
High degree of accuracy
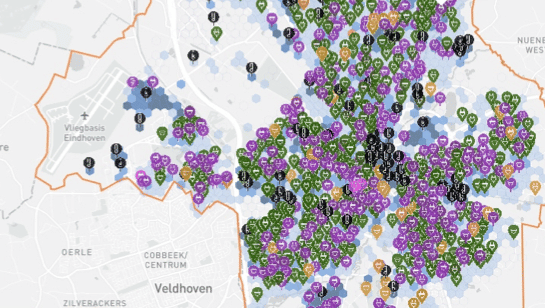
The EVtools Plan and Forecast maps show the expected charging needs for residents, visitors and commuters for each municipality down to street level, and the corresponding locations of charging points to meet these needs for the period up to 2025. Key context information is also included in the maps, such as the low-voltage grid, parking areas, construction sites and trees. Black crosses mark potential bottlenecks, such as issues with laying the charging infrastructure due to land ownership or grid congestion.
This high degree of accuracy is made possible by combining large amounts of data. The charging demand forecasts are produced by an algorithm developed by EVtools which is constantly being refined based on past experience. All kinds of demographic data are used: anonymised data from the Netherlands Vehicle Authority, geographical data, company data and even municipal tree registers. As a concession-holder, Vattenfall also contributed usage data from its existing charging points.
Definitive charging sites are determined in a validation process with all stakeholders. That is relatively simple, explains Vattenfall project manager Sjors van Hedel. “The maps work intuitively, they’re interactive and they’re user-friendly. For example, a track changes feature is built into the maps so that any user can comment on other people’s suggestions. Much more convenient than sending a constant stream of emails.”
Citizen participation
Alied sums up the whole process with plan maps in one simple sentence: you input a lot of intelligence up front and benefit from it later on. This is particularly effective when it comes to traffic orders. “Once the map is validated, the municipality can issue combined traffic orders. That is much faster and more efficient than issuing a lot of individual orders.”
The maps are also an excellent tool for citizen participation, something stipulated by the new Environmental and Planning Act. Sjors: “The plan maps are an easy way of showing residents spatial dilemmas; that little bit of local knowledge that residents can provide helps refine placement policies. In municipalities that have used the EVtools plan maps, there is a significantly lower number of objections to traffic orders.”
Grid congestion
The maps also show the low-voltage grid, which is a very handy way of spotting potential grid congestion at an early stage, according to Alied. “Then you can discuss a solution, which could entail Enexis expanding the grid or us looking for another location, for example. The plan maps have helped enormously in this area. It is good to see a partnership develop between Vattenfall, Enexis and EVtools, with a lot of mutual trust.”
The maps reveal the true extent of the problem of grid congestion. Alied: “In the usual scenario in which a charging point is installed where demand already exists, the problem is fragmented. With our method, you look at all the sites together to see if the required grid capacity is there. This shows the scale and urgency of the problem much more clearly, which is more meaningful for the discussion at national level.”
Data-related roll-out
Phase 1 of the project has just been completed, and the plan maps for some of the municipalities have been validated. The roll-out of the charging points is data-driven. Sjors: “We can’t tell the installation contractor to go and install a few thousand charging points the next day. They need a constant and even flow of work. So it’s all about thinking where the greatest need exists. All charging points are important, but some are more important than others.”
Three criteria are used: the existing network and its usage, the utilisation rate of the network and finally the forecast of the expected usage in a particular place. That is entered in a mathematical model, which then produces a priority list. Alongside the maps and data-driven roll-out, the EVtools Workflow tool provides a way of streamlining the implementation process.
Constant workflow
Vattenfall and EVtools are collating the municipalities’ experiences to see how they can further improve the process. From its own experience, Vattenfall is aware that public authorities’ decisions are not always based on plan maps derived from data: there are also political considerations. For example, policy-makers in smaller municipalities might want a charging station even though there is little or no demand for charging, which would mean a lower return on the charging point for a CPO such as Vattenfall.
Another point to note is that not all municipalities make decisions equally quickly. Some find validating a plan map complicated, while others take longer to make decisions on traffic orders. Vattenfall, on the other hand, has an interest in ensuring a constant flow of work for the installer. Sjors: “If a municipality doesn’t issue its traffic order quickly enough, the process stalls.” However, he adds a caveat: “It’s the same for us as well. It’s important to plan well in advance and stick to your schedule. If you don’t, the municipality will reallocate its people elsewhere.”